Advanced Technical Analysis
You'll Master: Candlestick Patterns, Chart Formations, and Fibonacci Retracements
Candlestick Anatomy
Price Blueprint:
Each candle tells the market story through its body and wicks
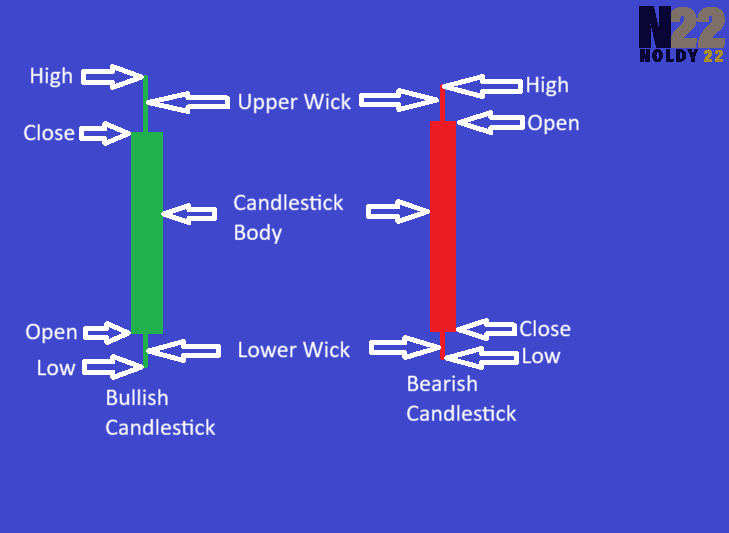
Key Components:
- Body: Open to Close price
- Upper Wick: High price
- Lower Wick: Low price
- Color: Green (Price Up) / Red (Price Down)
Colors may vary based on the settings of the trading app/platform that you are using
Candlestick Patterns Explained
Market Sign Language:
Patterns are the market's way of showing its next potential move
Three Main Pattern Types:
Bullish Patterns (Prices Likely Rise)
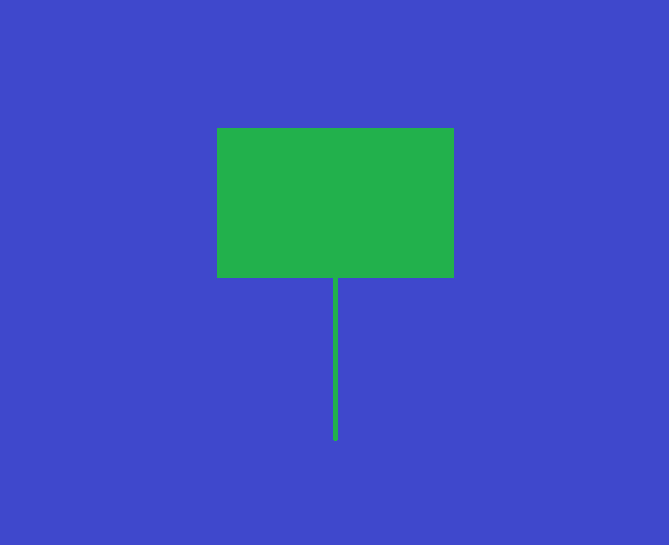
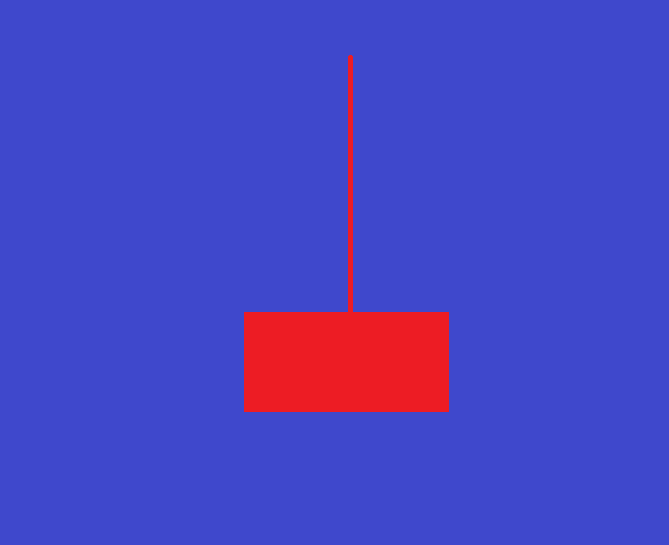
Hammer Pattern
Like hitting bottom - sellers try to push down but buyers hammer the price back up
- Small body at top
- Long lower wick
- Appears in downtrend
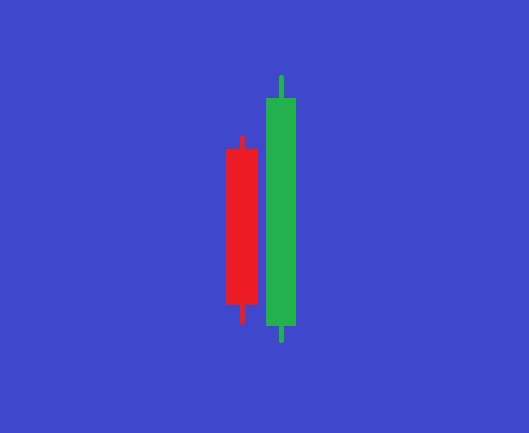
Bullish Engulfing
Like sunrise after dark - buyers completely overpower previous sellers
- Green candle swallows red candle
- Closes above previous open
- Big volume preferred
Bearish Patterns (Prices Likely Fall)
Shooting Star
Like a failed rocket - buyers try to push up but crash back down
- Small body at bottom
- Long upper wick
- Appears in uptrend
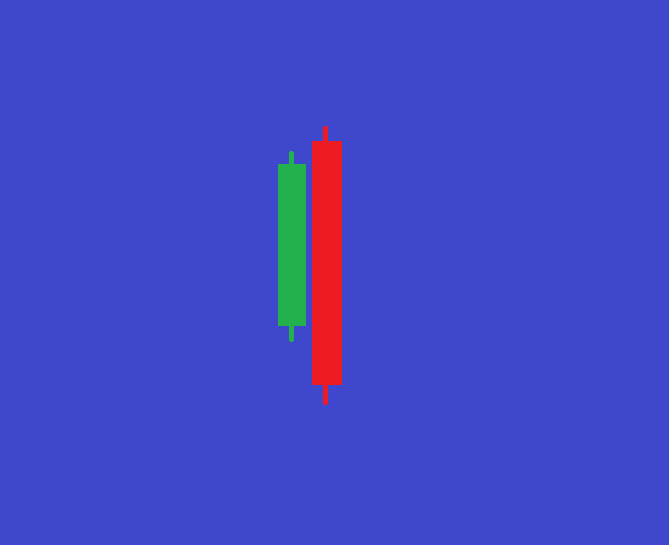
Bearish Engulfing
Like storm clouds covering sun - sellers overwhelm previous buyers
- Red candle swallows green candle
- Closes below previous open
- Big volume preferred
Neutral Patterns (Market Hesitation)

Doji
Tug-of-war tie - buyers and sellers equally matched
- Very small body
- Long wicks both sides
- Needs confirmation
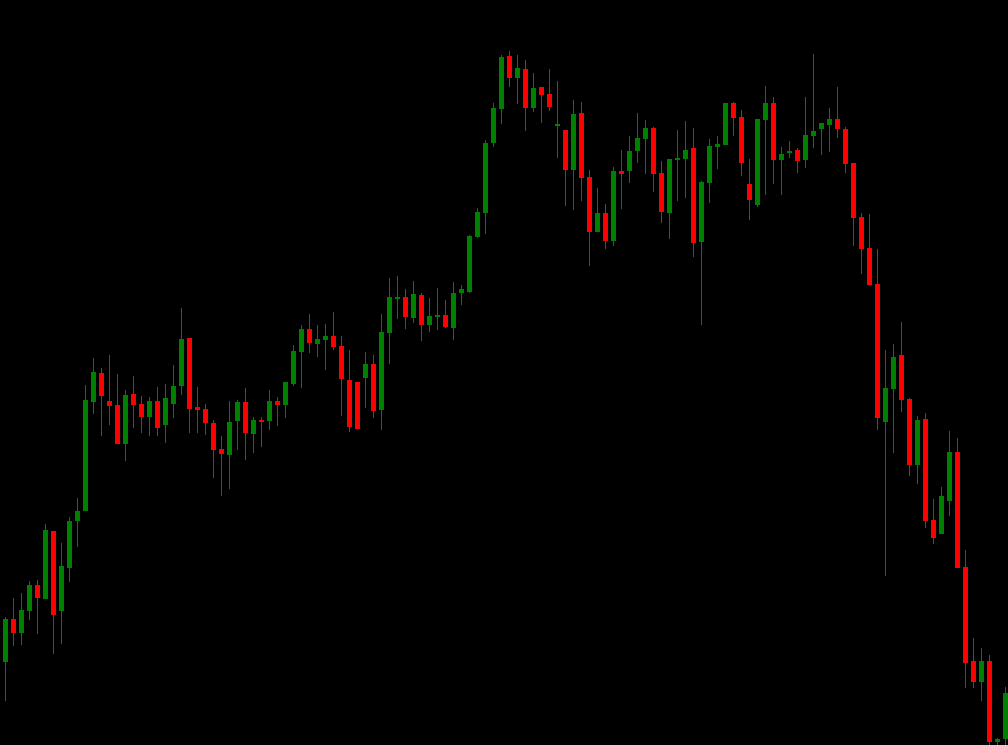
Real Market Example
After two red candles, hammer forms → Price reverses upward!
Chart Formations Decoded
Common Patterns:
1. Head & Shoulders
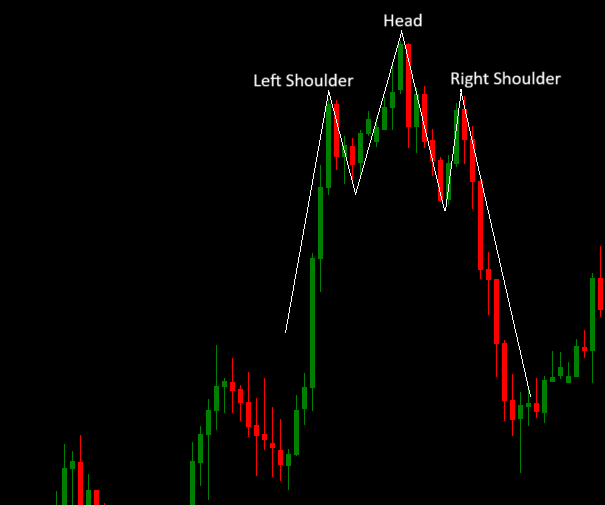
What it Means: Signals trend reversal after three peaks (left shoulder, head, right shoulder)
2. Double Top/Bottom
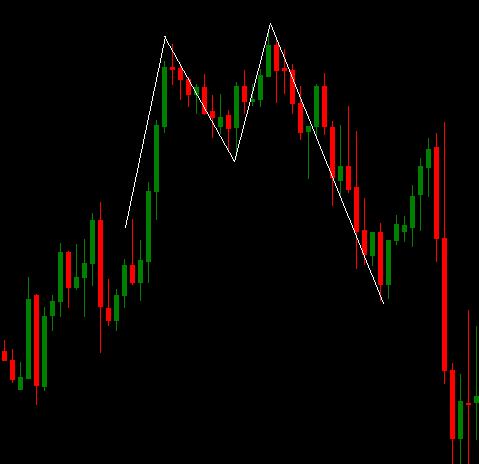
What it Means: Two failed attempts to break price levels indicate potential reversal
3. Triangle Patterns
Ascending Triangle
(Bullish Continuation)
Descending Triangle
(Bearish Continuation)
Look for these two and more chart patterns as your assignment
Fibonacci Magic
What is Fibonacci Retracement?
A tool using mathematical ratios (23.6%, 38.2%, 50%, 61.8%, 78.6%) to predict support/resistance levels
How Traders Use It:
Identify recent major price swing (high to low)
Draw Fibonacci levels between these points
Watch for price reactions at key levels
The best key level is 61.8
Live Example:

Practice Zone